This is a guest post from app lifecycle management platform Localytics; a similar version was published on their blog.
Nearly 25% of apps downloaded are never used more than once – up from 22% just two years ago. Creating an engaging user experience is becoming increasingly important as brands develop their mobile offerings and hope to meet user expectations. The key? Tracking critical app engagement metrics and using those to inform actionable solutions. We’ve outlined the eight metrics you should be measuring and employing to better understand users, improve app health and increase retention across the board.

Some people gloss over this metric, but tracking your users is fundamental to creating deeper engagement, like segmenting audiences, tracking specific behavior and launching successful app marketing campaigns. Tracking users also allows you to go beyond just downloads (after all, a user can download your app and never actually open it) and one-time opens. Once you know your user base and current active users, you have a baseline for improving engagement to increase users across channels, those who have dropped out of a desired funnel, or to identify churn risks and commonalities. You also gain greater insight into the monetization behavior of users, including the degree of usage, who makes in-app purchases, and who clicks through to ads.
Session length is measured as the period of time between app open and close, or when the app times out after 15 seconds. It indicates how much time your users are spending in your app per individual session. Tracking the length of user sessions is critical to unlocking revenue potential in your app flows, or, the various in-app scenarios your users encounter. If you’ve got an mCommerce app, how long does your checkout flow take? If the average session length is five minutes and your checkout flow takes six, you need to either encourage users to stay in the app longer or simplify the checkout process.
Session interval is the time between the user’s first session and his or her next one, showing the frequency with which your users open the app. This is your baseline for showing retention – it’s about how often users open your app in a given time period. When you know the typical time lapse between sessions per user segment, you can better optimize the user experience to prompt regular opens.
For example, if you notice that tablet users have longer session intervals than smartphone users, it might be that you need to improve screen flow or design in your tablet app. That could lead to a positive change in terms of shortening the interval between sessions for those tablet users. It could also be an indication that you should consider adding contextual in-app or push messaging to encourage more immersive interaction on a regular basis.
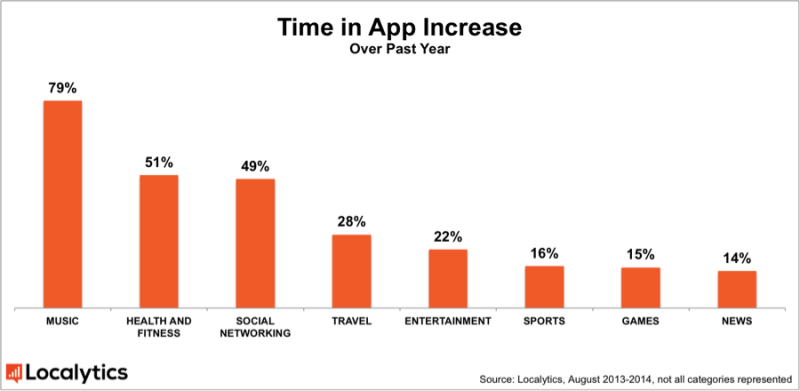
Time in-app tracks how long a user was in your app over a period of time, e.g. user X was in my app for three of the last 24 hours. It’s another metric for identifying how often your app is being used and how engaged your users are in the app experience. Similar to session length and interval, this engagement metric measures behavior over time to give you a clear view of usage patterns and trends.
If a certain segment of your users is consistently opening your app for long periods of time, you need to dig into the “why?” Are they all following a similar screen flow, making more purchases, or doing research? Longer time in-app is always something to strive for, but only if the user is gaining value out of their experience during that time. Use information like this to kick off personalization initiatives to boost usage and further engagement.
Acquisitions represent the number of users who download and install your app from a certain location, through organic search, word-of-mouth, paid campaigns or in-app referrals. This metric is especially important to track when you run campaigns through paid partners like Facebook to promote app downloads. Acquisitions reports track how much money you’re spending to acquire these users, their app downloads and what they’re doing when they get into your app.
Running paid acquisition campaigns comes down to ROI, and not just in terms of downloads per campaign – an initial metric that might show success, but only paired with long-term metrics. You can analyze the ongoing value of acquired users against organic users, or discover which users from certain campaigns have a higher LTV (Lifetime Value; see #8).
Screen flow tracks exits by screen, flow between screens, and total occurrences of visits to screens, visualizing the typical visitor interactions in your app. With screen flows, you can look at a particular screen in your app and see both what users did while on screen and where they went afterwards. In looking at how users navigate your app, you can get a clear sense of problem areas, conversion road bumps, and drop off screens.
Screen flow analytics show you exactly what those users who didn’t complete a stage did instead, enabling you to fine-tune your app’s flow to increase conversions. With this data in mind, you can implement redesigns to create clearer funnels, or create in-app marketing campaigns to re-engage dropped users, like Localytics customer Voxy did in their screen flow analysis.
Retention is measured as the percentage of users who return to your app based on the date of their first visit. Also referred to as cohorts, retention tracking highlights your most engaged – and valuable – users, creating better targeting capabilities and allowing you to track in-app purchasing by the level of engagement. Splitting out retention rate based on important dimensions like purchase frequency, location, or device, you can experiment with personalization to improve your app.
Analyzing retention allows you to determine what’s working and what isn’t in your app over time as updates occur. If you released a new version, one of the first things you should identify is whether or not your retention has changed. Building retention is key to funnelling primed users to conversions and purchases, as creating a highly-engaged user base is the best way to boost LTV and revenue.
Lifetime value is your primary revenue metric, representing the financial value of the app and how much each app user or customer is worth in his or her lifetime. It can be split out by average monthly value or value per customer, capturing worth over time financially and also in terms of loyalty and evangelism. It can also be tracked as revenue per customer, a slightly different formula that correlates directly to purchases, both in-app and across other channels for overall spend.
LTV can show growth over time for different segments, i.e. by acquisition channel or monthly cohorts, and signals how much more can you spend toward acquisition to gain more of these users and still turn a profit. It also represents the value of mobile vs. non-mobile customers; which user segment spends more, is more loyal, and is a bigger brand evangelist.
Measuring and optimizing for the right engagement metrics is the key to attaining and keeping users. And whether your business model is driven by in-app advertising, purchases, or paid subscriptions, driving your revenue is fundamentally dependent on creating engaging experiences with personalization. These metrics are your foundation for personalization: in truth, you cannot create a customized experience for app users without knowing about their in-app usage.
Using these insights to inform redesigns, UX changes, messaging campaigns like push, email and in-app, and build stronger funnels will boost ROI and make your app a standout in your brand’s overall marketing strategy.